
- create a raster of your data. Whether you chose natural neighbors, an IDW grid, whatever, does not matter. Any resolution that will not exaggerate you data coverage will work.
- use raster calculator to convert this grid to an integer grid. You can use Raster Calculator under the Spatial Analyst tool and simply multiply your grid by 0. You need to put your expression between parentheses, with an "int" in front. For example: [mb_int_grid] = int([mb_grid] * 0)
- Also under Spatial Analyst, use the Convert Raster to Features to convert your integer grid to a polygon.
- You can now alter your polygon symbology to give you a nice outline.
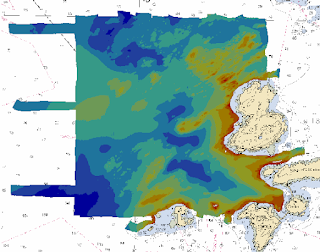
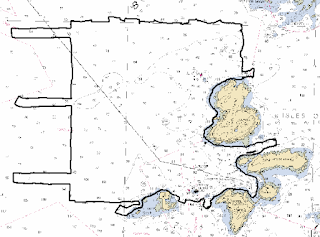
Below you can see my original gridded data and the resulting outline.
No comments:
Post a Comment