I am not sure if the old version of GeoMapApp supported such an easy import/export of data, but the new version, released October 1, sure does!
Here is how to bring in your data, view it, color and scale by value, and export it to Google Earth in a jiffy. A jiffy, of course, being relative to the amount of data you actually have.
1) Under the File menu, import your data into GeoMapApp. This can be a shapefile, a 2D grid, or a table/spreadsheet in ASCII or Excel. I selected an Excel file of oceanic transform fault data and it worked flawlessly.
2) Once loaded, your data should display on the map and the data table will appear below. On the right you will notice several options related to the data table, including Color by Value and Scale by Value. Selecting these brings up a drop down box of all your data parameters. Select one and a color bar will pop up that you can edit. Once done, be careful not to close out the colorbar box or you will lose your settings (perhaps a bug? I simply minimize it to get it out of the way).
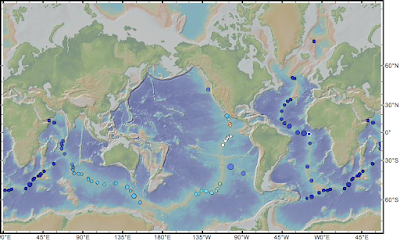
Here is what the transform fault data look like, colored by slip rate and sized by length:

3) To export to Google Earth simply click on the save drop-down box on the right and select Export to Google Earth (KMZ). You can either export selected data points or your entire table. Once you make your selection, a box pops that enables you to select which parameters to export. The next step lets you choose what parameter the placemark name will take, as well as rename parameters and set units. Once you click okay, GeoMapApp will export the kmz file.
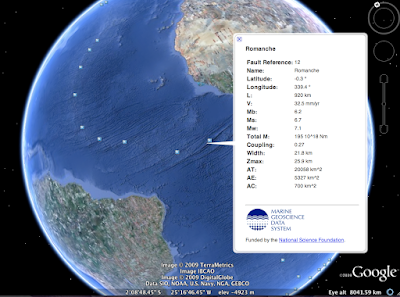
Here is my exported kmz file inside Google Earth:

It does not color the placemarks by the value you selected in GeoMapApp, nor does it allow you to select your icon, but these things can be edited in the kmz file itself. What it does do is provide an easy way to get the data into Google Earth to begin with. Simply click on a placemark, and all your parameters for that point pop up!
So there you have it! Quick and easy data visualization in two great (and free!) geospatial data applications!

No comments:
Post a Comment